Understanding how Sales are trending will give you essential insights into how your business operates. At a high level, everything may appear to look great. But once you see how the numbers are made up, you may see opportunities to improve your revenue. In this post, we will cover how to understand sales trends in your data.
Table of contents
If you look at your top-level sales numbers, you will know immediately how sales are tracking. They will be moving upward, downward or staying neutral. Take Figure 1 as an example. Over the calendar year so far up to October, sales are tracking upward. Great, but this doesn’t tell us too much. Later, we will cover how to analyse sales trends. Analysing how your sales are trending allows you to understand the underlying trends hidden in the numbers.

Reasons why understanding sales trends is important
There are several reasons why understanding sales trends are important. It allows you to:
- Understand what is contributing to an increase or decrease in overall sales
- Identify what product lines need your attention
- Pinpoint where marketing budget should be targeted at
- Determine if a marketing campaign has worked
How to analyse sales trends
We focus here on three approaches to understanding sales trends. In reality, you will use all of these combined.
Breakdown by sales lines / products
The first thing you need to do is to break down your top-level numbers from Figure 1 by product or product line. The aim is to get to a breakdown that makes sense and will lead to insights.
In Figure 2 you can see that the product line “Mens Football Shoes” has been declining in 2021 yet overall sales have been increasing in Figure 1. That’s the first insight that can be drawn from the analysis. You now have something to focus on.

Compare against previous time periods
Another technique that is one of the most common is comparing time periods against previous ones. You can compare years with years, months with months, weeks with weeks etc. Comparing the same day in previous years will be valuable for specific days. For instance, Black Friday is an example of such a day when you would want to compare sales of earlier years. Furthermore, understanding how you are trending relative to where you were at a particular point last year or in the current month can be extremely valuable. You can use year to date comparisons. This allows you to answer the question of how I am trending this year compared to where I was last year. Figure 3 shows examples of all these.

An important point is that companies will also compare sales numbers to sales targets (or sales budgets and forecasts). To keep things relatively simple, we haven’t considered these here.
Percentage growth
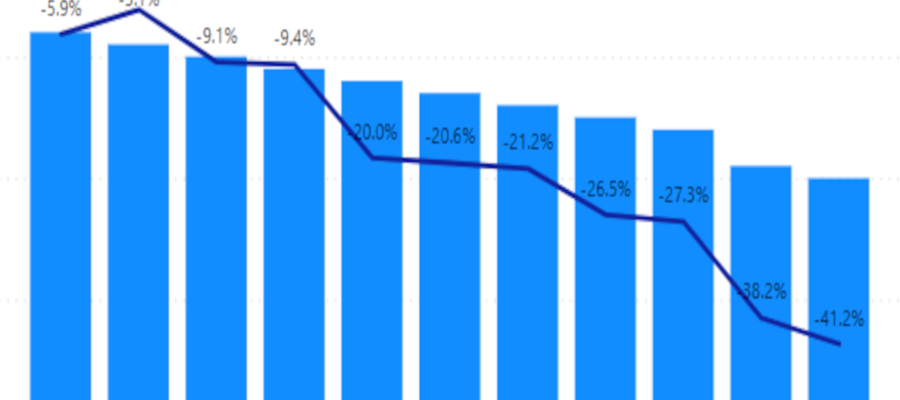
Analysing the percentage growth is a great way to see how sales trend. This will tell you how fast your sales are increasing relative to the period before. On the other side, it will also tell you how fast your sales are declining if they track negatively. Figure 4 shows the negative percentage decline of “Mens Football Shoes” relative to same month the previous year. At a glance you know you need to take action to prevent further declines.

Example of an emerging trend
Here is an example from Performa. Take the timeframe covering August and September. In the United States, the school year runs from September to June. If you compared Sales in September in 2019 versus, 2018 and 2017 you might start to see a trend emerging. In our example, Performa starts to see an uptick in sales in September. When they drill down on this it is attributable to the sales of children’s and teenagers’ sports shoes. The reason for this is the school year begins in September in the US. It is trending upward due to more parents on-line shopping in the back-to-school rush.
This is extremely valuable information to Performa allowing them to capitalise on this further. They can create marketing campaigns to grow sales further by offering additional products for school goers return back to school.
Conclusion
In conclusion, we have discussed that understanding your sales trends gives you essential insights into how your business operates. Once you have identified what needs your attention, you can take action to rectify it. You can also monitor any activity you take as it will be reflected in future sales trends. This allows you to ensure the actions you take are working or if you need to course correct. We hope you now know how to understand sales trends in your data.
All images were produced using Power BI.
This article is part of our How to make more money for your business using data series.


